SIEM Integration: Azure Sentinel
Written By XavierBe
Last updated 12 months ago
Lupovis integrates with Microsoft Sentinel through an Azure Event Hub, allowing threat intelligence to flow directly into your SIEM in real time. The Event Hub acts as the ingestion point for Lupovis alerts and enriched signals, which Sentinel then processes using its built-in analytics and automation rules.
This setup ensures that high-fidelity indicators from Lupovis are continuously available for detection, correlation, and automated response across your entire Azure security stack.
Configure the Event Hub
The easiest way to deploy a Logic App and using the Event Hub integration is to deploy the following template
🎯 JSON Available here
lupovis-snare-logic-app.json
7.8 KB• Text
This setup deploys a Logic App that collects events in real time and forwards them to your Log Analytics workspace. Once the data is ingested, it becomes available for use within Microsoft Sentinel.
The steps to deploy the template are outlined below.
This will act as the ingestion point for Lupovis data.
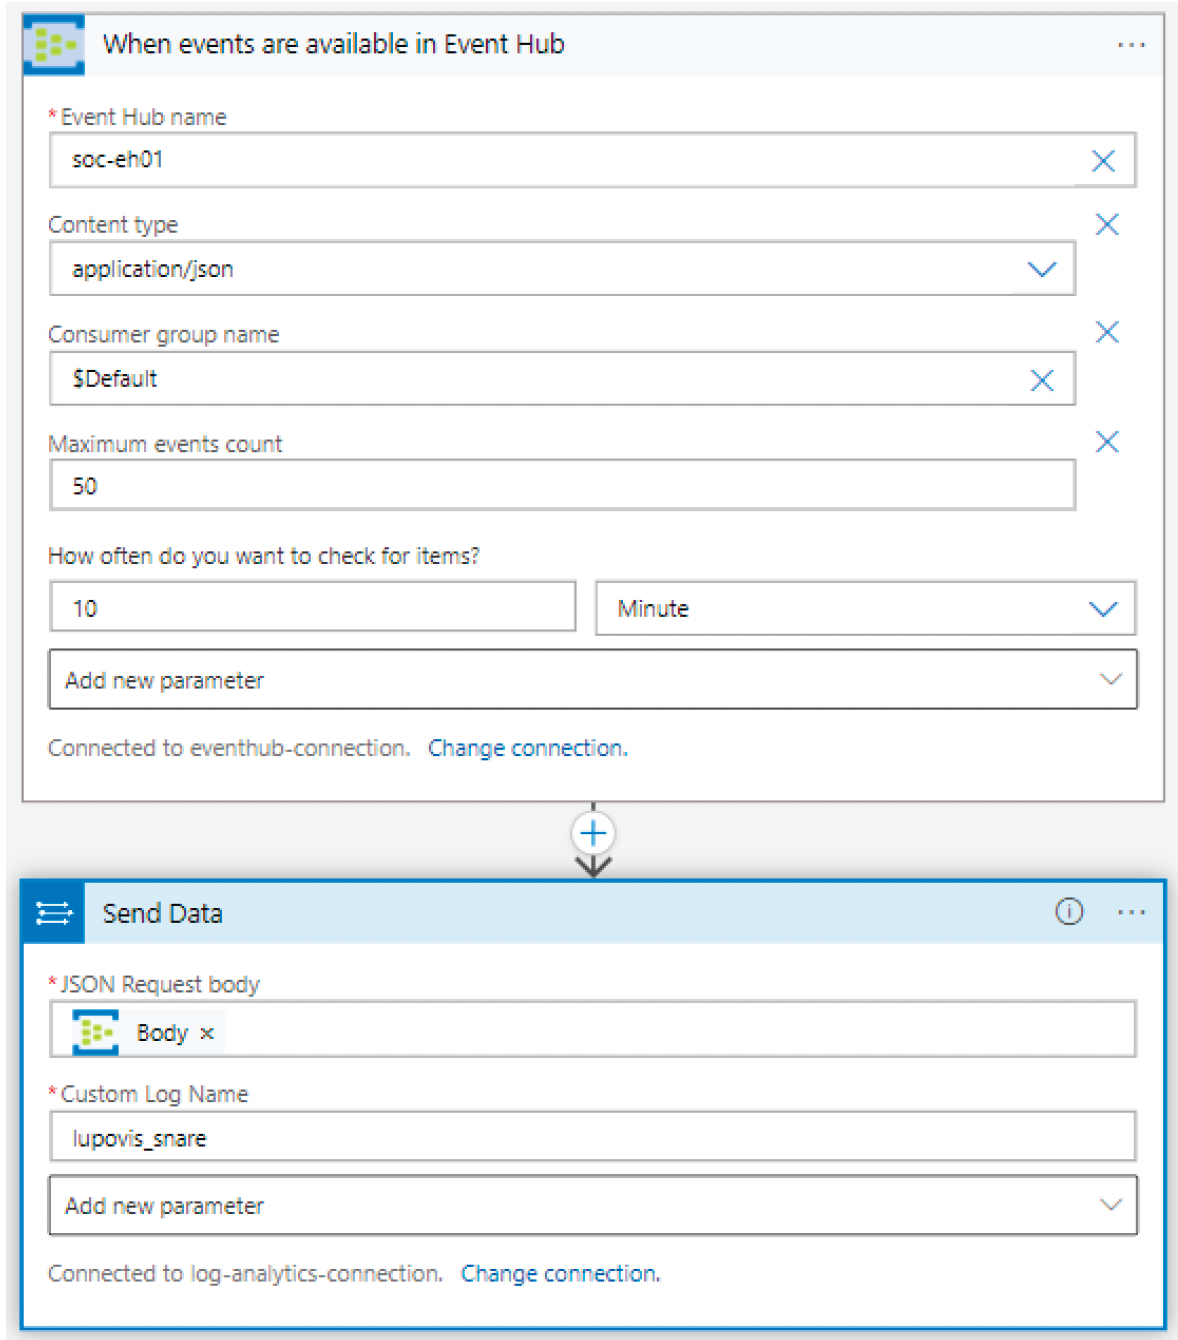
Your Event Hub should be created with JSON as the content type and with the default consumer group enabled.
The setup includes:
Event Hub name
Content type set to
application/jsonConsumer group set to
$DefaultMaximum events count
Polling interval (for example every 10 minutes)
This allows Sentinel to detect and pull new Lupovis events as soon as they arrive.
Build the Logic App to forward data to Sentinel
Create a Logic App using the “When events are available in Event Hub” trigger.
This trigger monitors the Event Hub and collects events in batches.
Then add the “Send Data” action for Azure Log Analytics.
Configure it with:
JSON request body set to the content of the Event Hub message
Custom log name set to
lupovis_snare
Once saved, the Logic App will continuously push data from the Event Hub into the custom Sentinel table lupovis_snare_CL.
Query Lupovis data in Sentinel
After data starts flowing into Sentinel, you can run KQL queries to view and filter attacks.
For example, to list updated indicators labelled as “indicator-of-intelligence”:
lupovis_snare_CL | where ContentData_status_s == "Updated" | where ContentData_ttps_s contains "indicator-of-intelligence" | project TimeGenerated, ContentData_ttps_s, ContentData_sourceip_sCorrelate Lupovis with security events
The following example extracts source IPs from Event ID 4624 and enriches them with Lupovis threat context:
let LogonList = Event | where EventLog == "Security" | where EventID in ("4624") | where RenderedDescription !has "Address: - Source Port: -" | extend SourceIP = extract("(([0-9]{1,3})\\.([0-9]{1,3})\\.([0-9]{1,3})\\.(([0-9]{1,3})))",1,RenderedDescription) | extend Message = extract("(.*?)\\.",1,RenderedDescription); let ThreatFeed = lupovis_snare_CL | where ContentData_status_s == "Updated" | extend info = ContentData_ttps_s; LogonList | join kind=leftouter ThreatFeed on $left.SourceIP == $right.ContentData_sourceip_s | where ContentData_sourceip_s == SourceIP | summarize by Message, SourceIP, ContentData_status_s, info This allows analysts to quickly identify sign-ins that originate from IPs associated with scanning, exploitation, or other suspicious activity.
Inspect indicators and metadata
The enriched entries include fields such as:
ContentData_ttps_scontaining behavioural labels like “web-traversal”, “scanning”, “indicator-of-intelligence”ContentData_sourceip_scontaining the hostile IPContentData_status_sto track updatesTimeGeneratedto understand when the indicator was last observed
These fields can be used in detections, hunting queries, alert automation, etc.
Extra resources
Was this helpful?
Still need help? Share an idea