SIEM Integration: Elastic Integration
Written By Craig Russell
Last updated 29 days ago
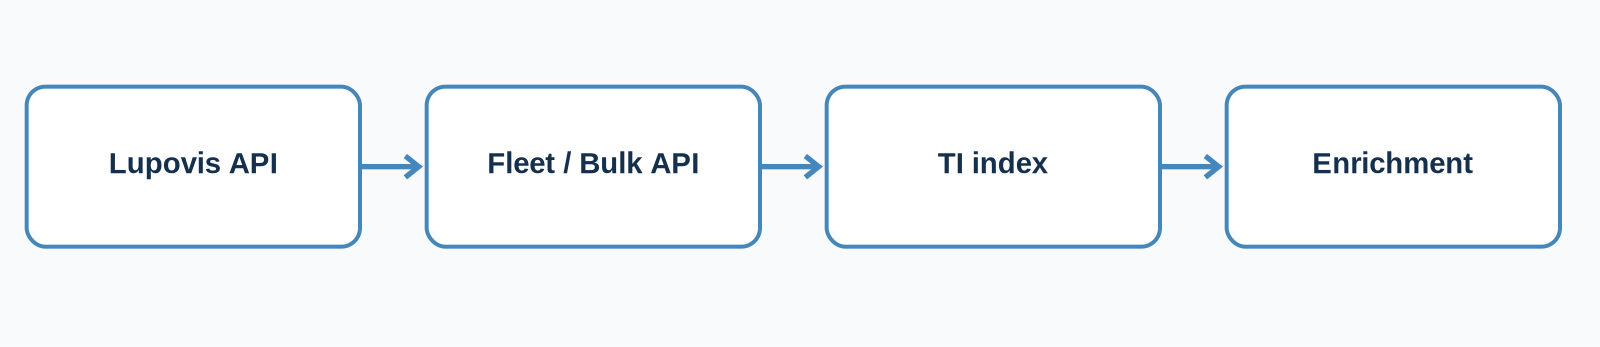
Lupovis Prowl provides curated threat intelligence covering hostile IP addresses, observed attacker behaviour, tactics, techniques and procedures (TTPs), and geographic context.
Integrating this intelligence into the Elastic Stack enables security teams to enrich existing telemetry, correlate suspicious activity and prioritise investigations using intelligence derived from real-world attacker interactions.
This guide explains how to ingest Lupovis Threat Intelligence into Elasticsearch using two methods:
Elastic Fleet: A managed integration using Elastic Agent and the Custom API integration.
Direct API ingestion: A scriptable approach using the Lupovis API and Elasticsearch Bulk API.
It also covers configuring enrichment policies, correlating events using ES|QL and applying the intelligence to security operations.
1. Prerequisites
Before starting, ensure you have:
Access to a Lupovis Prowl subscription with threat intelligence API access.
A valid Lupovis API key.
An operational Elasticsearch and Kibana deployment.
Appropriate privileges to create indices and enrichment policies.
An Elastic Agent managed through Fleet, or a host capable of running
curlandjq.
The original guide's screenshots appear to use Elastic 8.17.4. Menu locations and integration options may differ depending on your deployed version.
Understanding the Lupovis feed
Lupovis provides threat intelligence through its API, including information about hostile IP addresses and associated activity.
The API endpoint used in this guide is:
https://api.snare.lupovis.io/data/GetBlockList
Two feed types are referenced:
The original documentation specifies type=general for production use. Confirm the feed's availability, response format and access permissions before deployment.
2. Method 1: Ingesting threat intelligence through Elastic Fleet
Elastic Fleet provides centralised management of Elastic Agents and integrations.
Using the Custom API integration, you can configure an Elastic Agent to periodically retrieve Lupovis Threat Intelligence and ingest the resulting records into Elasticsearch.
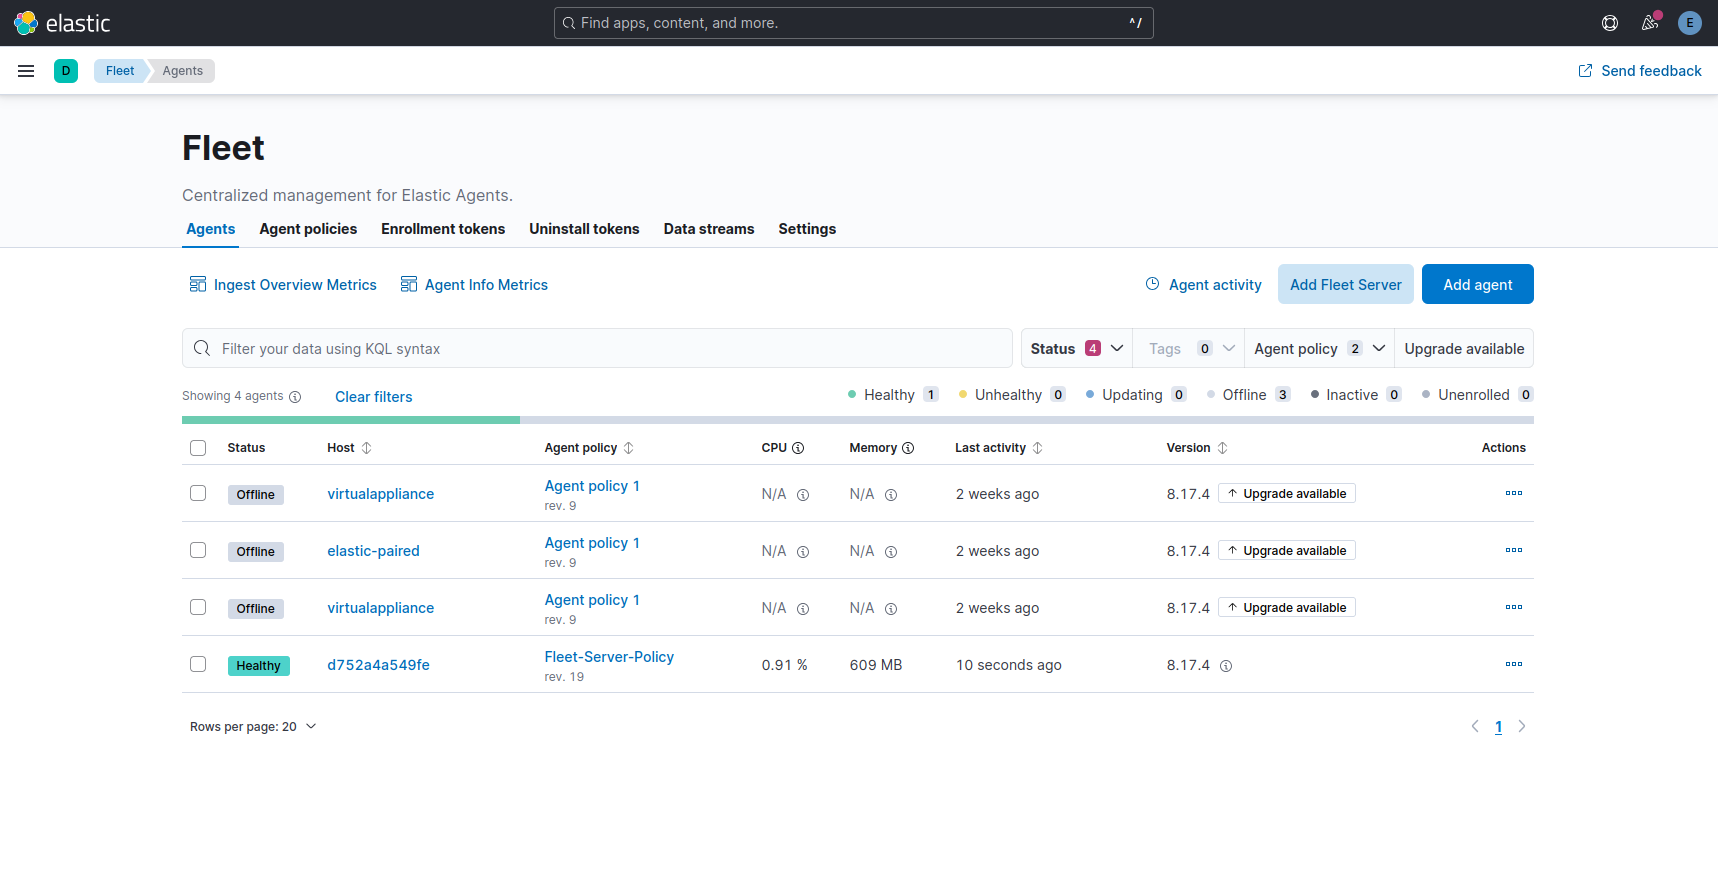
Step 1: Open Elastic Fleet
Sign in to Kibana.
Navigate to Fleet.
Open the Agent Policies section.
Select an existing policy or create a new one.
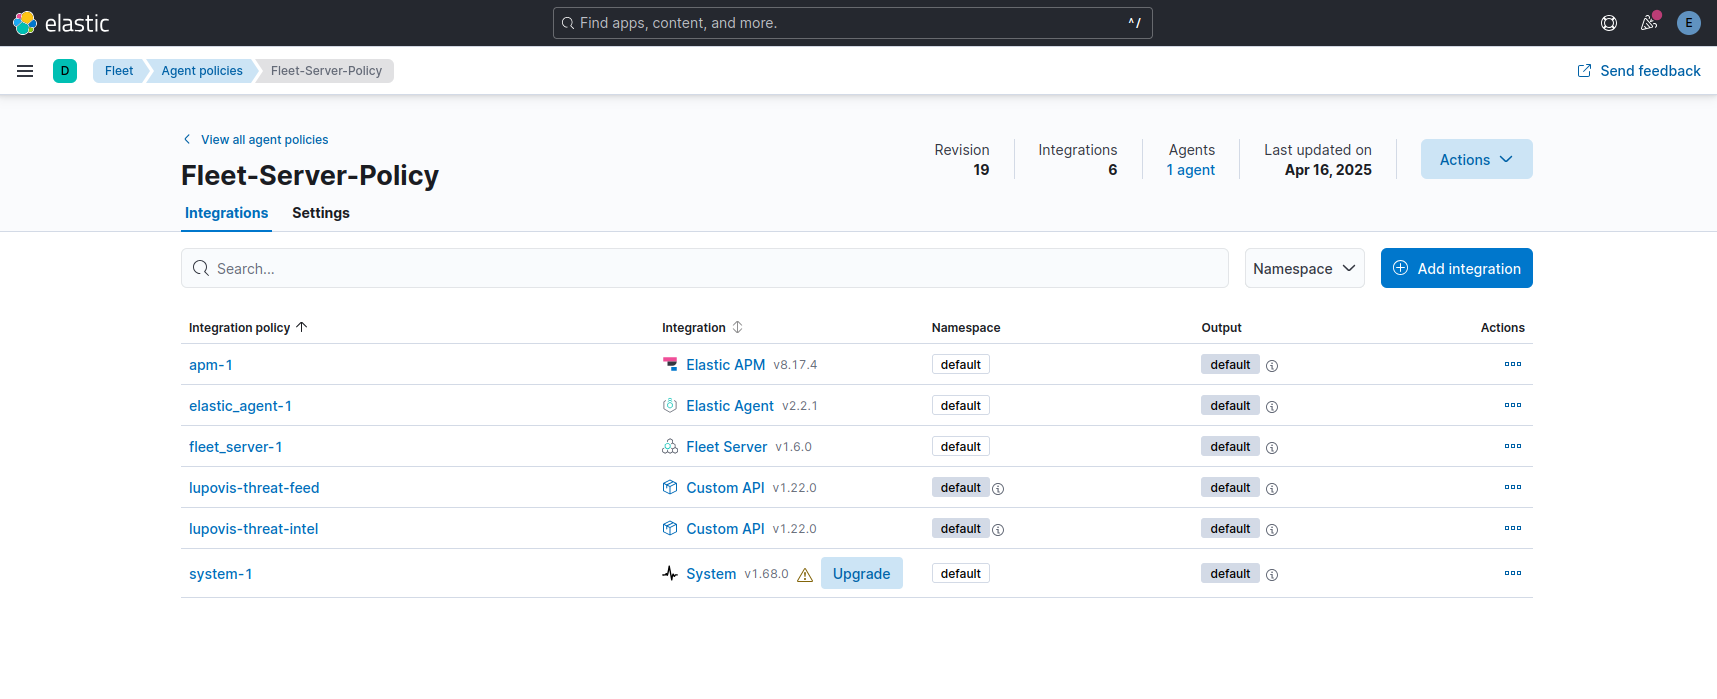
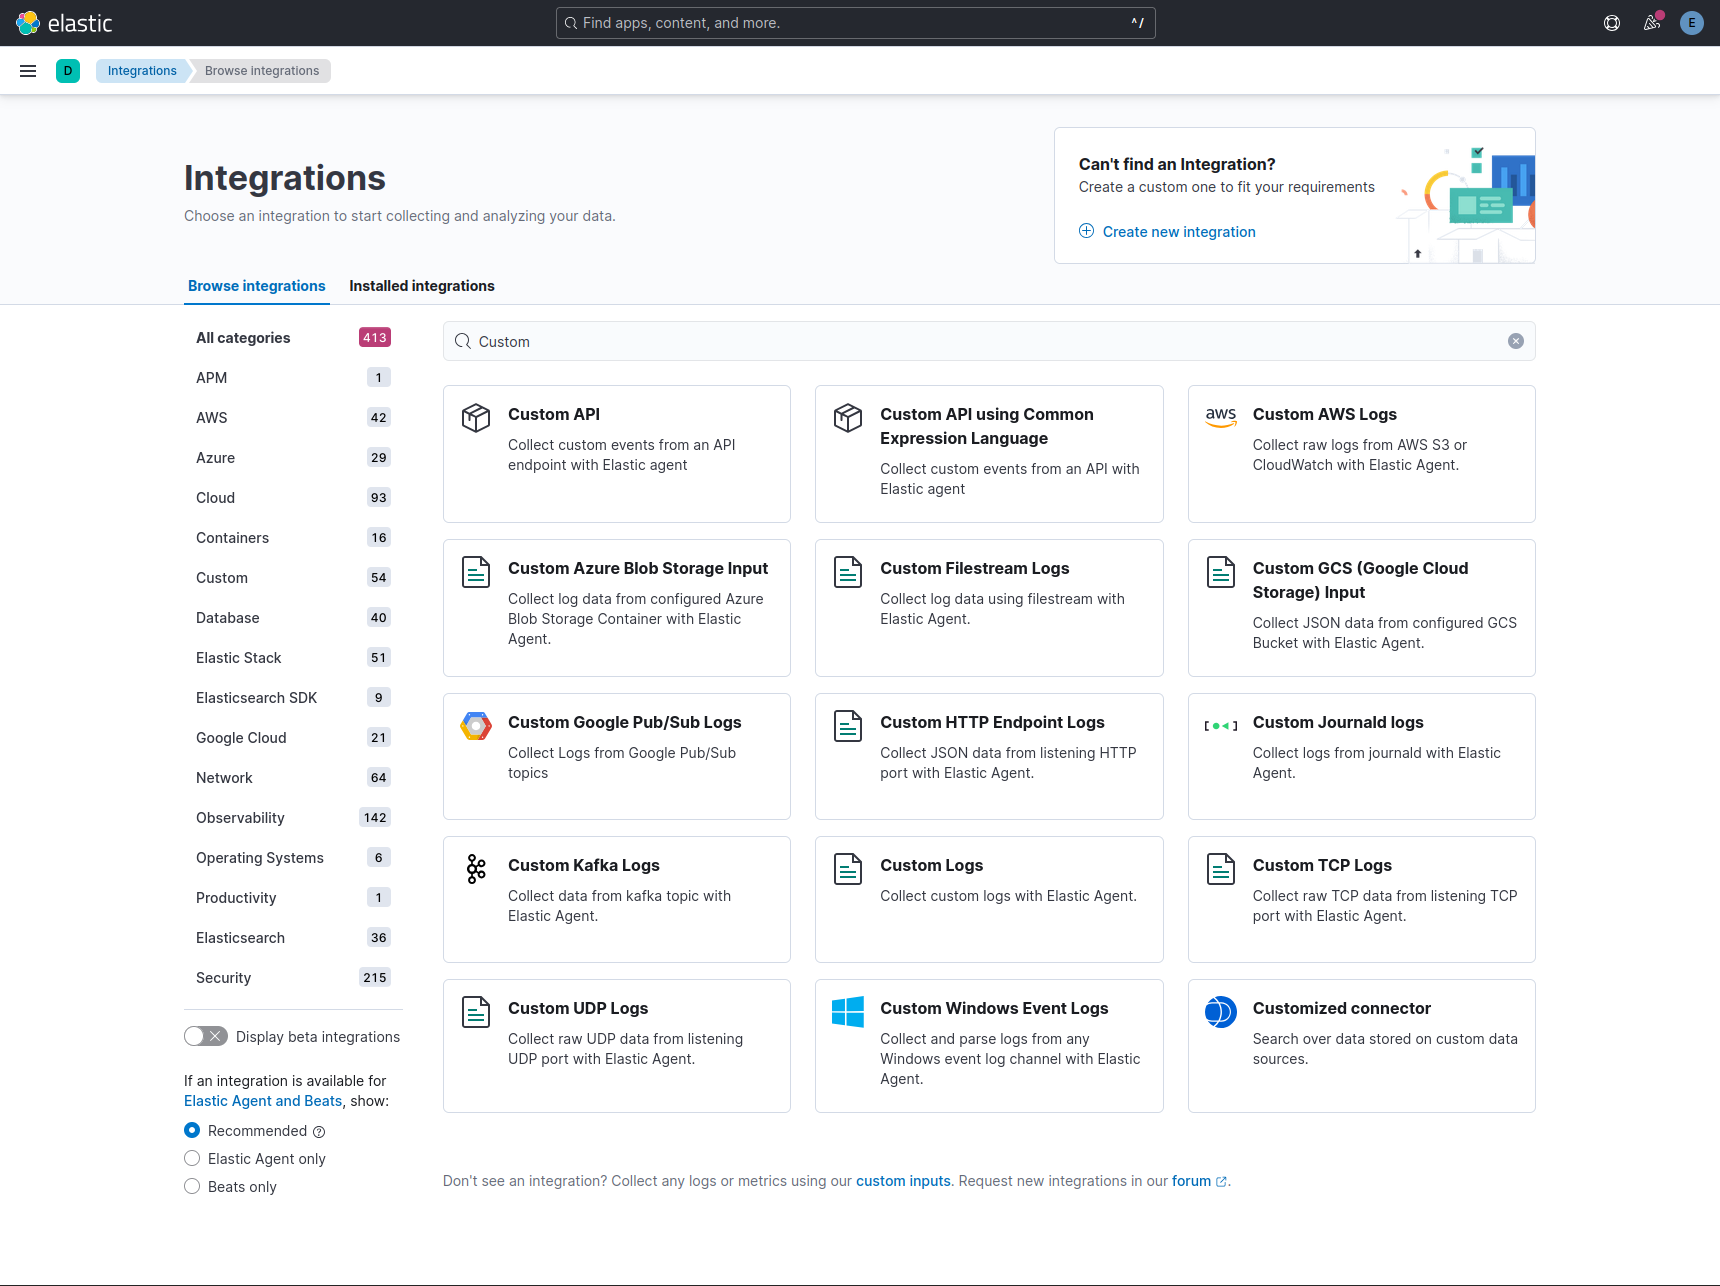
Step 2: Add the Custom API integration
Select Add integration.
Search for Custom API.
Select the integration.
Begin configuring the API request.
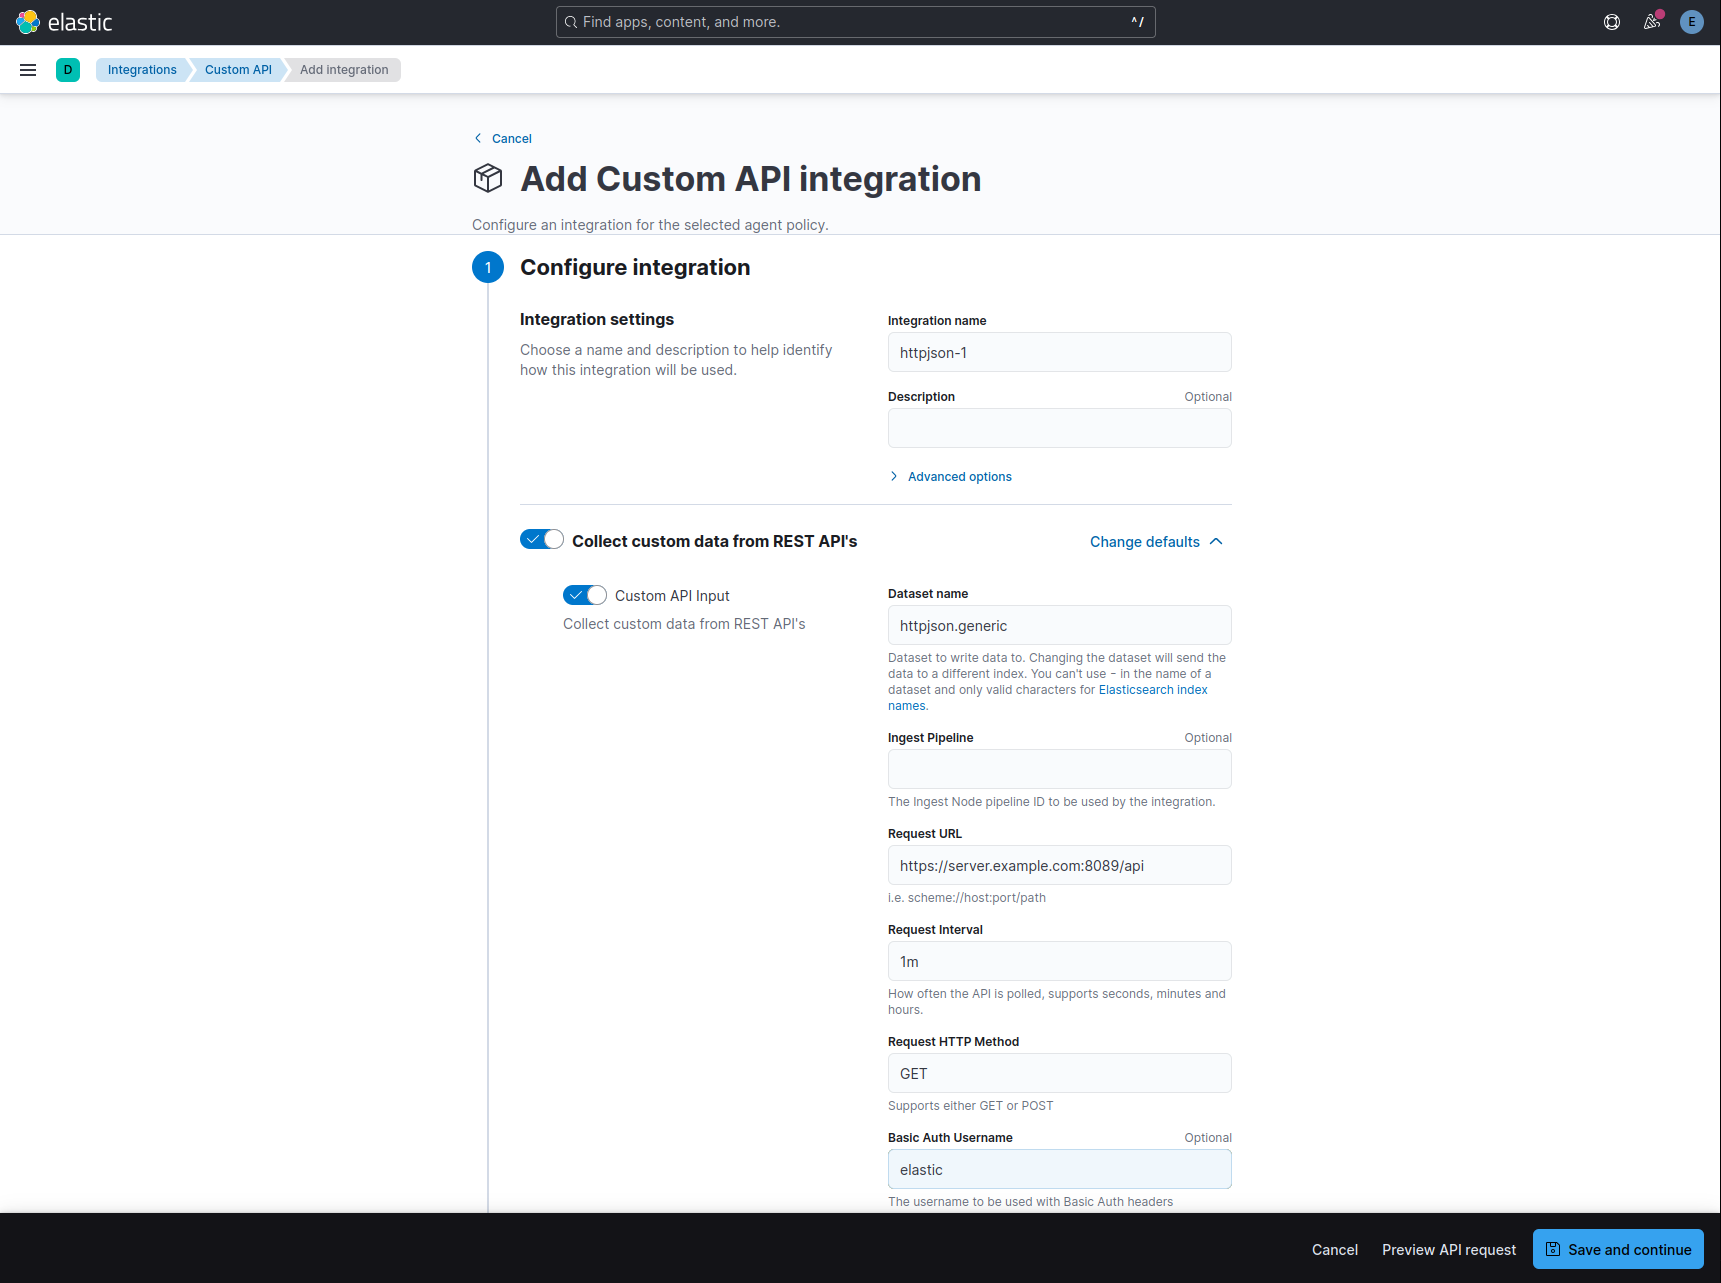
The Custom API integration allows Elastic Agent to retrieve data from an HTTP endpoint at a configured interval.
Step 3: Configure the Lupovis API connection
Configure the integration using the following settings.
Example request URL:
https://api.snare.lupovis.io/data/GetBlockList?type=example&code=YOUR_API_KEYReplace YOUR_API_KEY with your Lupovis API credential.
For production deployments, the original guide specifies changing the feed type to general.
Security consideration: API keys included in URL query strings may be recorded in application logs or diagnostic output. Review the authentication and secret-handling capabilities supported by your Elastic integration.
Step 4: Deploy the integration
Once configured:
Save the integration.
Deploy the updated Agent Policy.
Confirm that the Elastic Agent is healthy.
Allow the configured polling interval to complete.
The agent should begin retrieving Lupovis Threat Intelligence and forwarding the data to Elasticsearch.
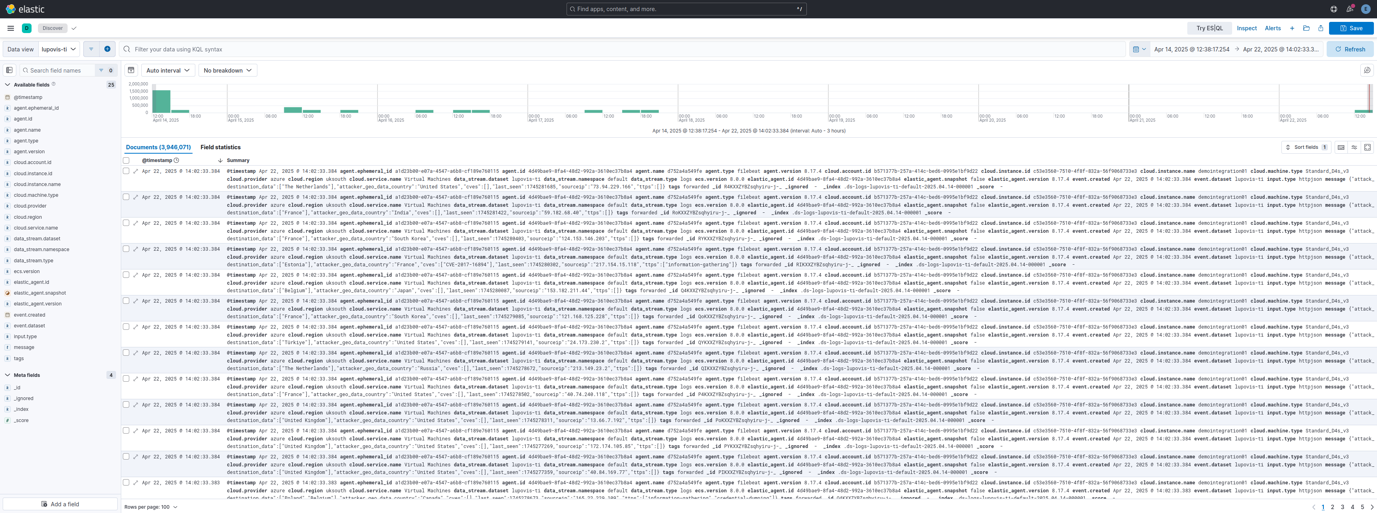
Step 5: Verify ingestion in Discover
Navigate to Kibana → Discover.
Select the data view corresponding to the Lupovis intelligence dataset.
The original guide expects records under:
logs-lupovis-ti-*The actual data-stream name depends on the integration's configuration.
Verify that:
Documents are being ingested.
Records contain source IP addresses.
Relevant intelligence fields are populated.
Timestamps are being parsed correctly.
The field mappings are suitable for enrichment.
3. Method 2: Direct API ingestion using Elasticsearch Bulk API
For environments that do not use Elastic Fleet, Lupovis Threat Intelligence can be retrieved directly and ingested into Elasticsearch.
This approach is useful when organisations prefer custom ingestion pipelines, scheduled scripts or automated workflows.
Step 1: Retrieve Lupovis Threat Intelligence
Set the required environment variables:
export LUPOVIS_API_KEY='REPLACE_ME' export ES_URL='https://your-elasticsearch-host:9200' export ES_API_KEY='REPLACE_ME'Retrieve the example feed:
curl --fail-with-body --silent --show-error --get \ 'https://api.snare.lupovis.io/data/GetBlockList' \ --data-urlencode 'type=example' \ --data-urlencode "code=${LUPOVIS_API_KEY}" \ --output ti.jsonThis saves the API response locally as ti.json.
Inspect the response:
jq 'type, (if type == "array" then length else keys end)' ti.jsonThe following ingestion example assumes the API returns a JSON array containing objects with a sourceip field.
Validate this against the actual API response before using it in production.
Step 2: Prepare the Elasticsearch index
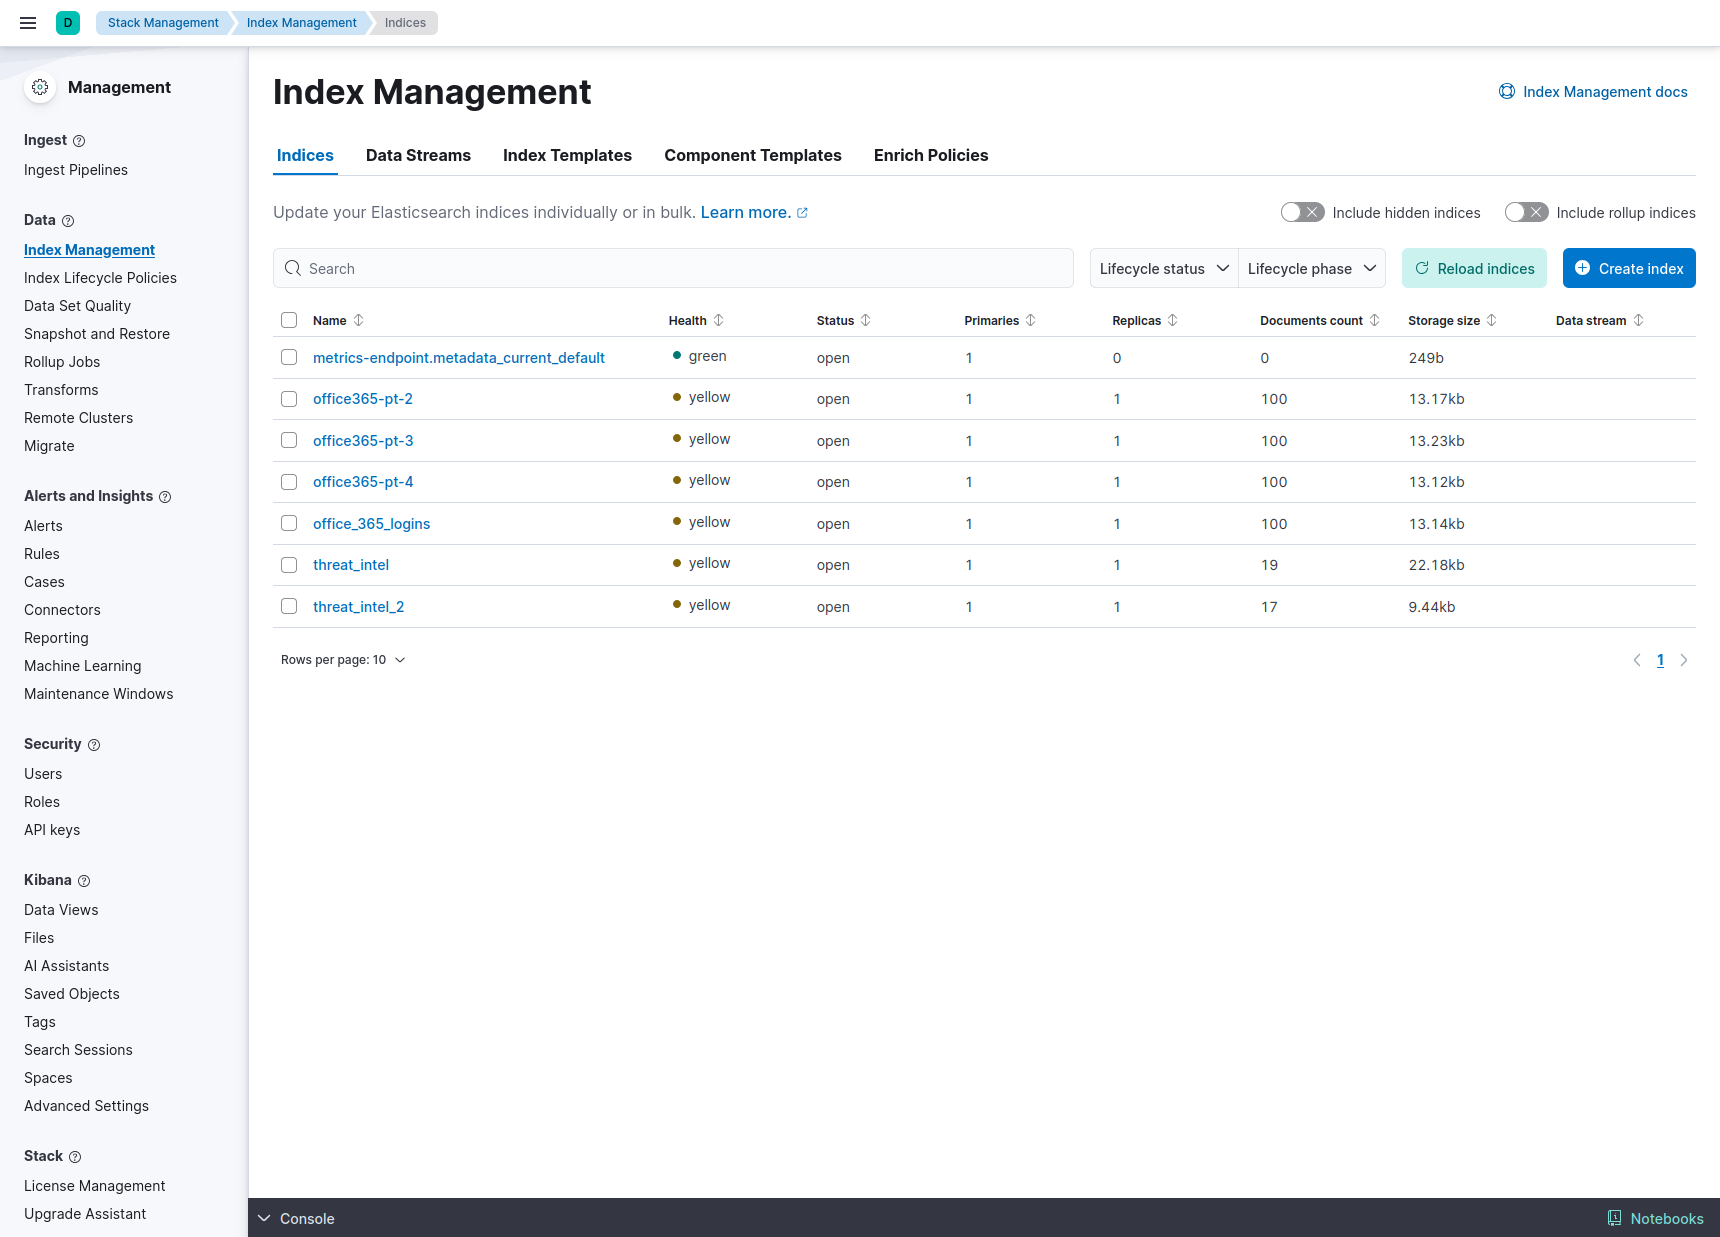
Open Kibana and navigate to:
Stack Management → Index Management
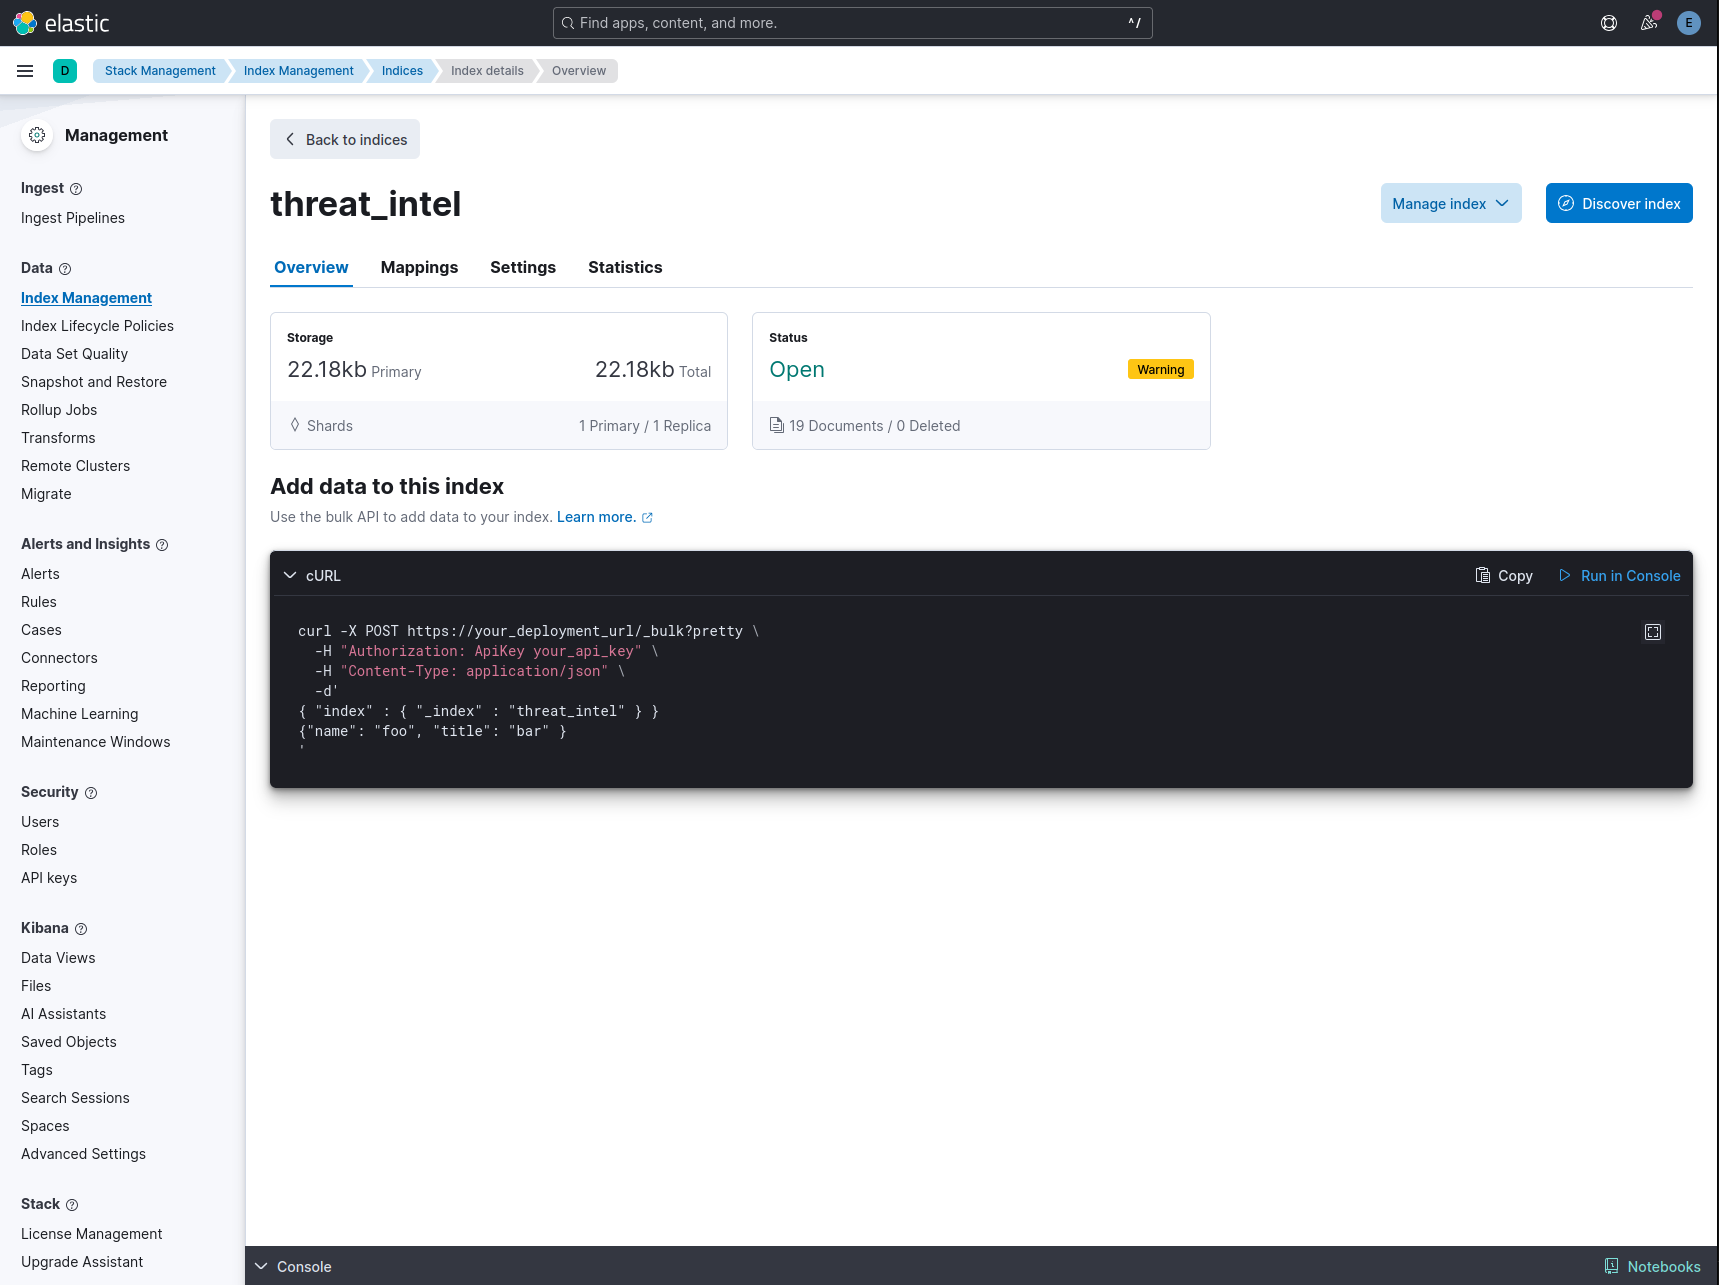
The threat intelligence records will be ingested into an index named:
lupovis-tiBefore production ingestion, configure appropriate mappings for the intelligence fields.
In particular, ensure that the source IP field uses a data type compatible with the enrichment workflow.
Step 3: Convert the feed into Bulk API format
The Elasticsearch Bulk API requires newline-delimited JSON (NDJSON), with action and document records on alternating lines.
Convert the downloaded feed:
jq -c ' .[] | select(type == "object" and (.sourceip | type == "string")) | {index: {_index: "lupovis-ti", _id: .sourceip}}, . ' ti.json > ti.ndjsonThis produces the required Bulk API structure.
Important: Using sourceip as the document ID means that multiple records for the same IP address will overwrite one another.
If your intelligence feed contains multiple distinct observations per IP, use a stable composite identifier instead.
Step 4: Upload the intelligence to Elasticsearch
Execute the Bulk API request:
curl --fail-with-body --silent --show-error \ -X POST "${ES_URL}/_bulk" \ -H "Authorization: ApiKey ${ES_API_KEY}" \ -H 'Content-Type: application/x-ndjson' \ --data-binary @ti.ndjson \ --output bulk-response.jsonInspect the result:
jq '{errors, failures: [.items[] | .index | select(.error != null)]}' bulk-response.jsonThe errors field should return false.
If errors are reported, inspect the individual failed operations to identify mapping problems, permissions issues or invalid documents.
Step 5: Automate ingestion
For continuous threat intelligence updates, the ingestion process can be scheduled using:
Cron jobs.
Systemd timers.
CI/CD pipelines.
Existing data ingestion orchestration tools.
For production environments, implement appropriate retry handling, monitoring, credential management and retention policies.
4. Configuring threat intelligence enrichment
Ingesting intelligence into Elasticsearch makes the data searchable, but its greatest operational value comes from correlating it with existing security telemetry.
Elasticsearch enrichment policies allow you to match internal events against reference datasets and attach additional context.
For example, a firewall event containing a source IP address can be enriched with information from the Lupovis threat intelligence index.
This allows analysts to investigate network events with additional knowledge of previously observed hostile activity.

Step 1: Identify the matching field
The Lupovis intelligence examples use:
sourceipThis field acts as the matching key between the intelligence index and internal telemetry.
The internal log source may use a different field name, such as:
source.ipclient.ipIP Address
The relevant fields must contain compatible values and use compatible data types.
Step 2: Inspect the threat intelligence mapping
Use the Elasticsearch API:
GET lupovis-ti/_mappingConfirm that the expected source IP field exists.
The original guide references intelligence attributes including TTPs, CVEs and geographic metadata.
However, the exact field names and types should be verified against the ingested feed.
Step 3: Create an enrichment policy
Navigate to:
Stack Management → Index Management → Enrich Policies
Create a new policy that matches records using the source IP field.
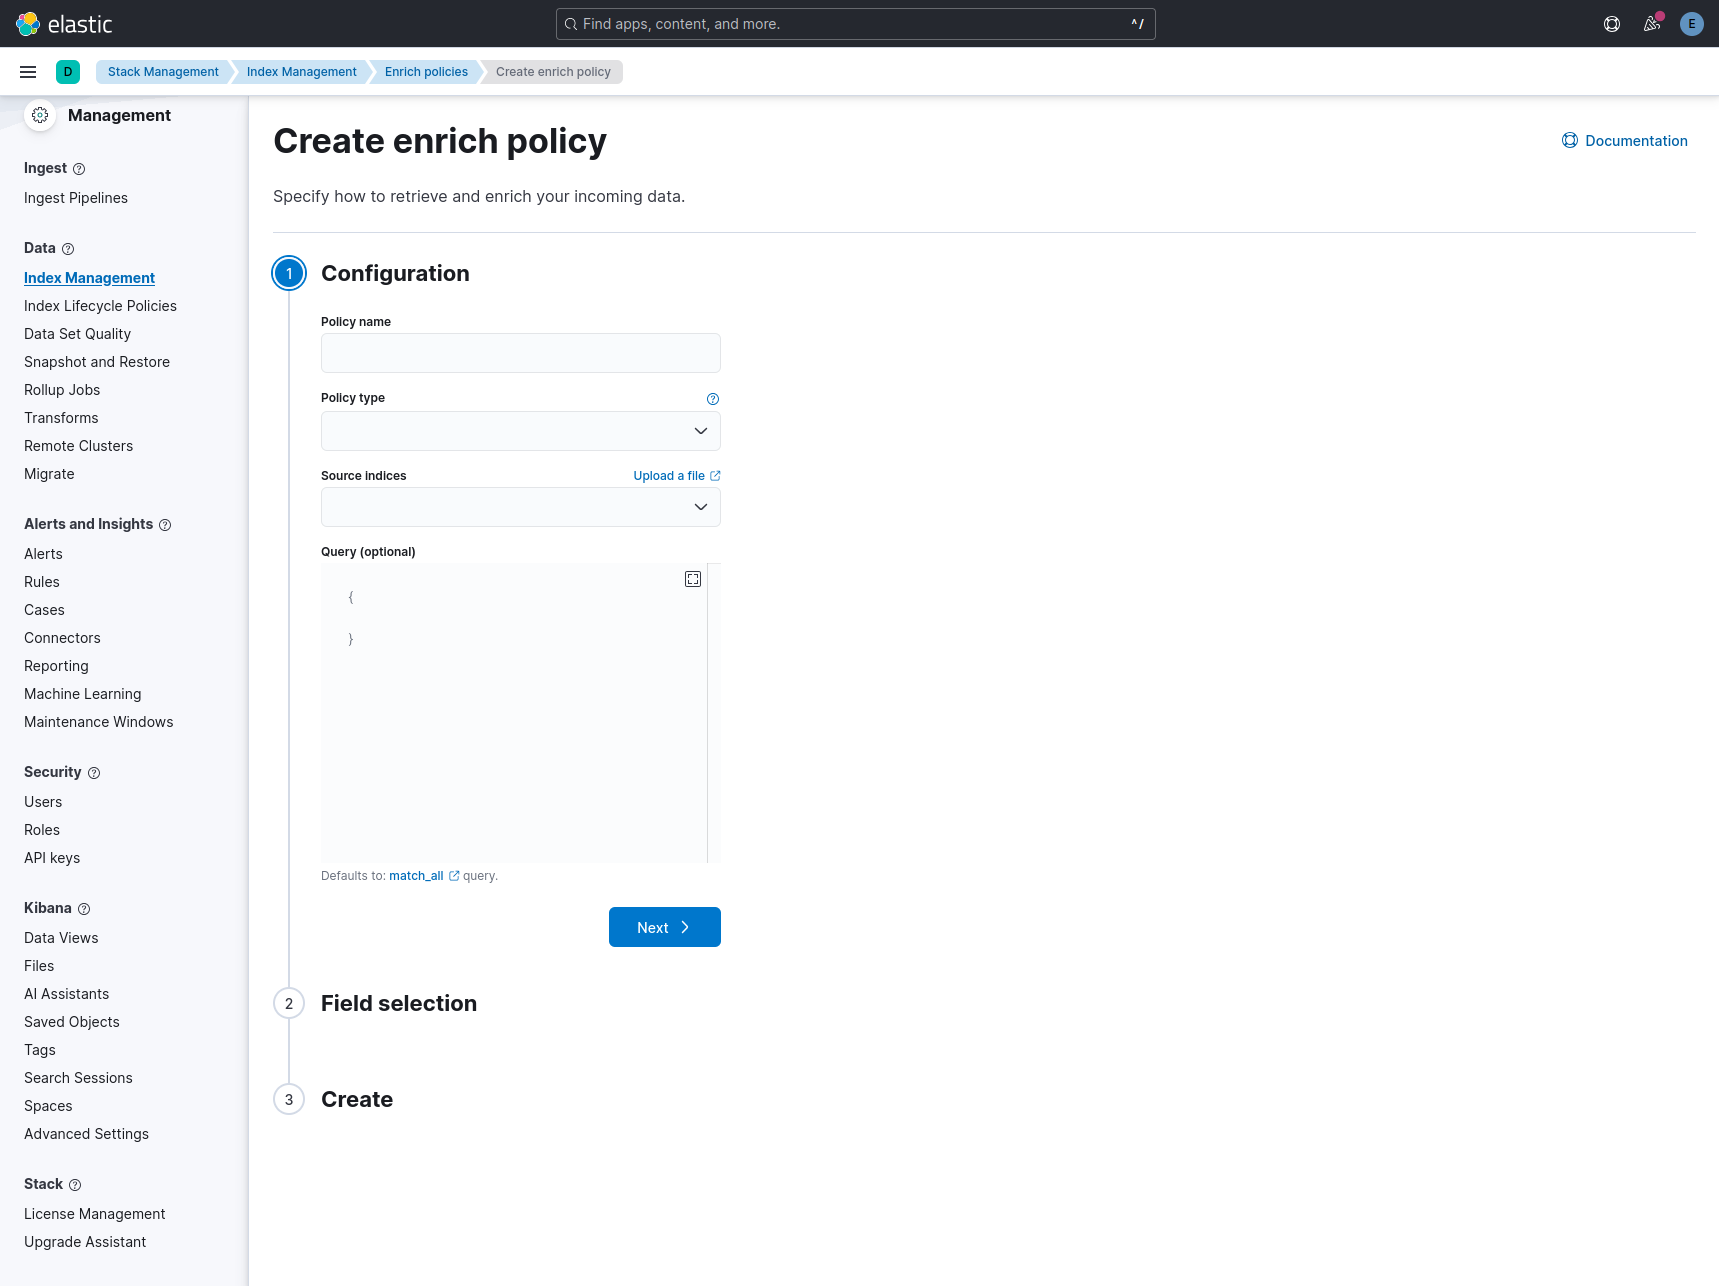
Alternatively, an enrichment policy can be created using the Elasticsearch API.
The following is an illustrative configuration:
PUT /_enrich/policy/lupovis_ti_enrich_policy { "match": { "indices": "lupovis-ti", "match_field": "sourceip", "enrich_fields": [ "ttps", "attacker_geo_data_country" ] } }The fields listed under enrich_fields must exist in your actual intelligence index.
Step 4: Execute the enrichment policy
Once created, execute the policy:
POST /_enrich/policy/lupovis_ti_enrich_policy/_executeElasticsearch builds an enrichment lookup index using the reference data.
Important: An enrichment policy does not automatically incorporate newly ingested threat intelligence.
After updating the Lupovis feed, re-execute the enrichment policy to refresh the lookup data.
5. Threat correlation using ES|QL
Elasticsearch Query Language (ES|QL) allows security teams to query, transform and correlate data across Elasticsearch datasets.
Combined with Lupovis Threat Intelligence, ES|QL provides a way to identify internal events associated with previously observed hostile infrastructure.
Use case 1: Enrich firewall logs
Consider an organisation ingesting firewall events into:
logs-firewall-*Each event contains a source IP address.
The following example enriches those events using the Lupovis intelligence policy:
FROM logs-firewall-* | ENRICH lupovis_ti_enrich_policy ON sourceip | WHERE ttps IS NOT NULLThe query:
Retrieves firewall events.
Matches their source IP addresses against the Lupovis enrichment policy.
Adds available intelligence fields.
Returns events containing populated TTP information.
This enables analysts to identify firewall activity associated with IP addresses observed performing hostile actions.
A missing TTP field does not necessarily mean that no intelligence match occurred. For complete match detection, use a field that is reliably populated in the feed.
Use case 2: Enrich Microsoft 365 sign-in events
Identity events are particularly valuable for threat intelligence correlation.
An organisation may ingest Microsoft 365 sign-in logs containing information such as:
User identity.
Source IP address.
Authentication outcome.
Timestamp.
Application or service.
The original guide uses an example index named:
office365-logins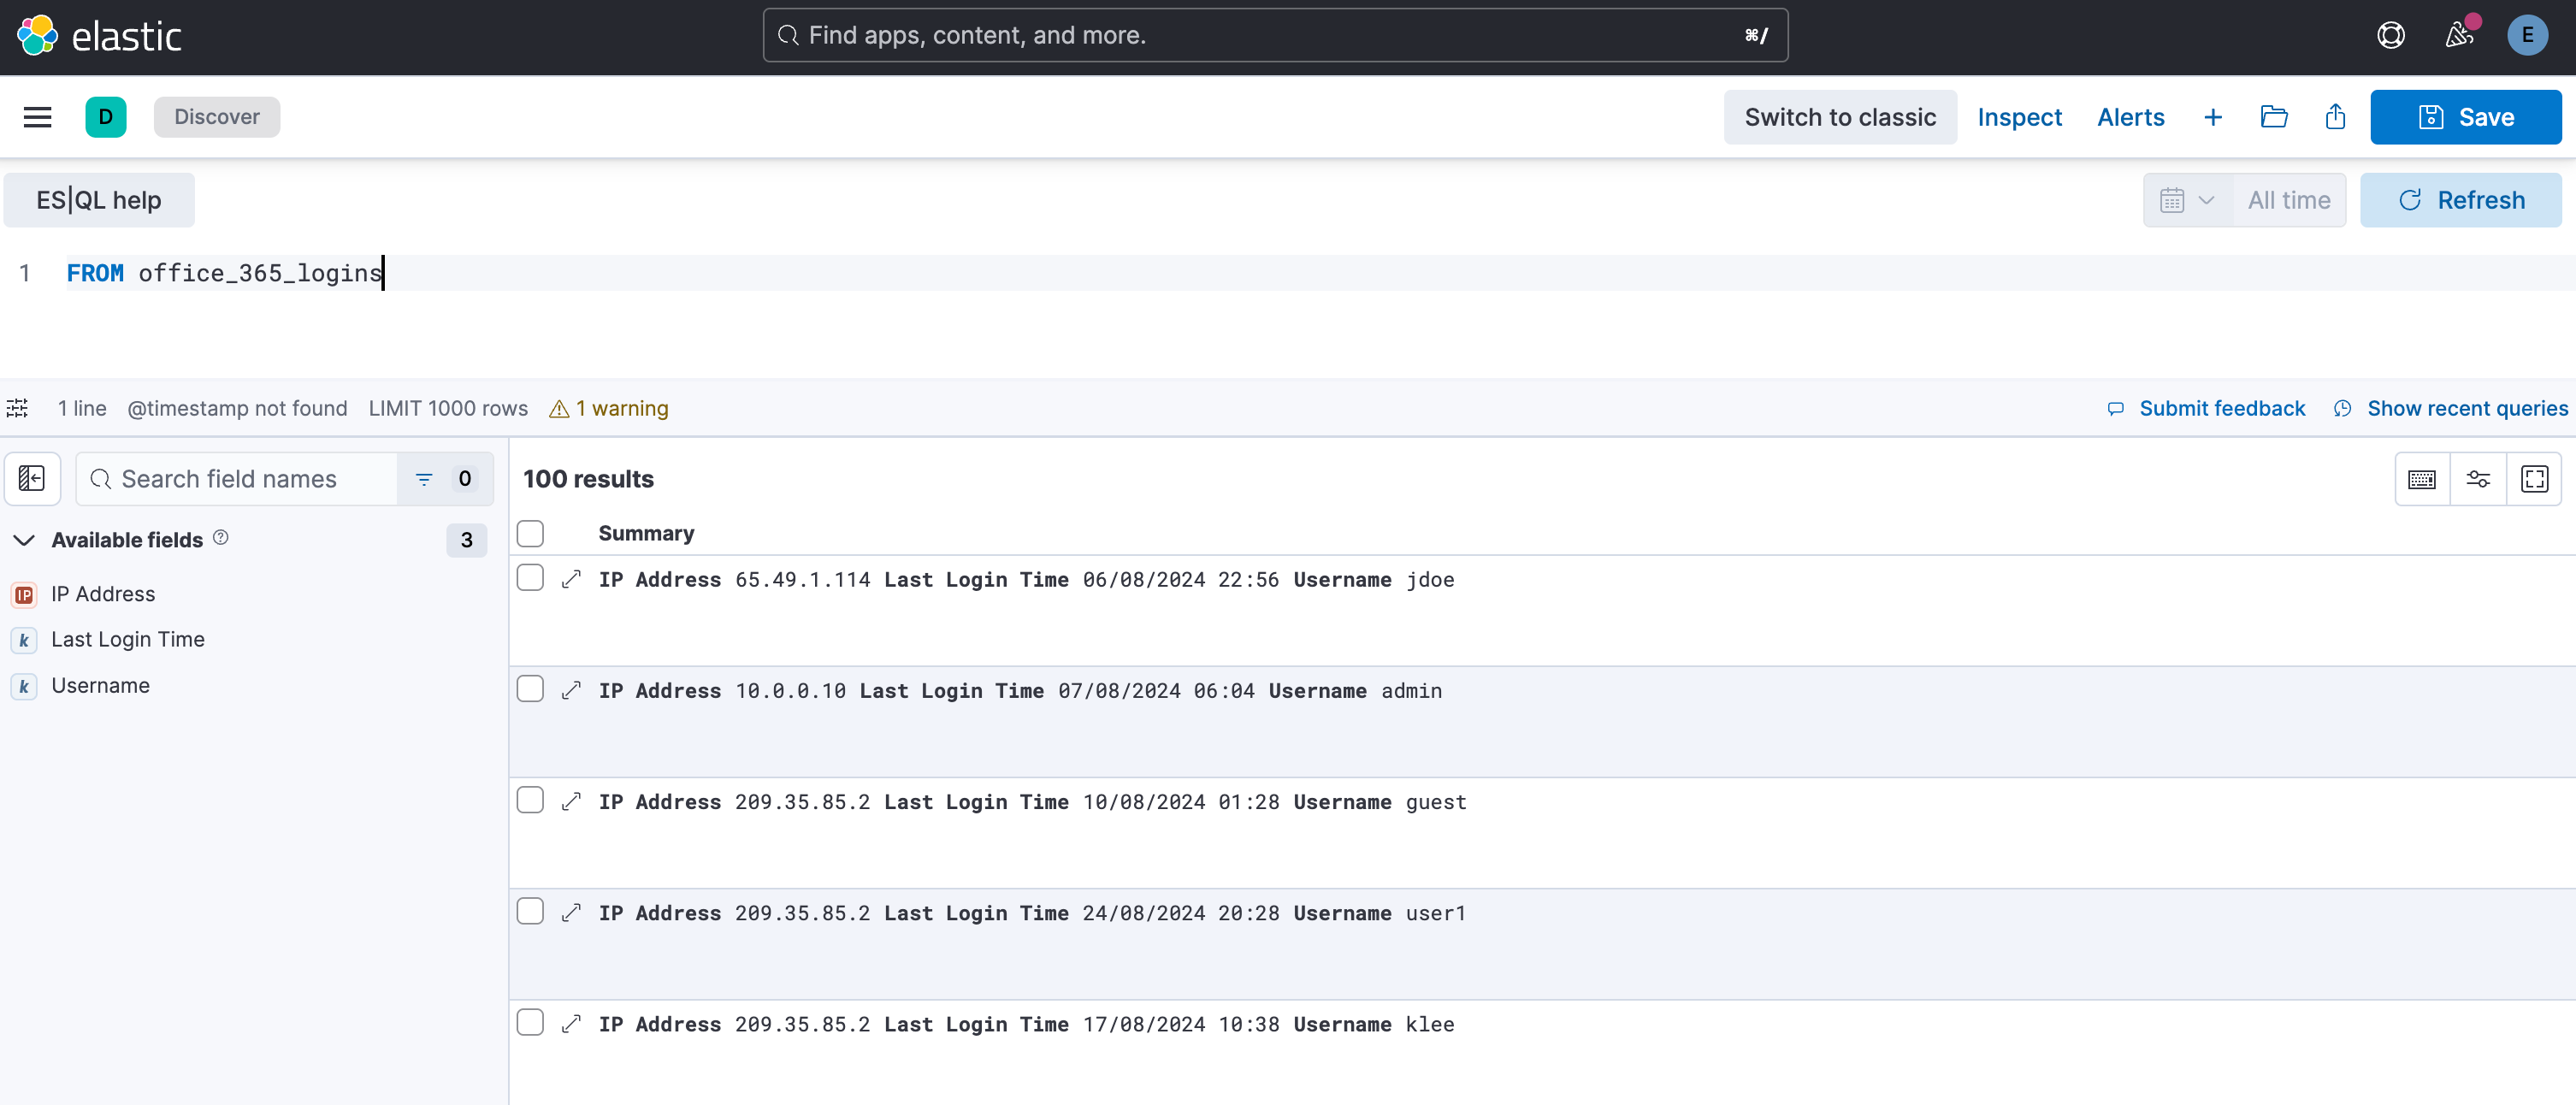
In this example, the source IP field is named:
IP AddressThe following ES|QL query illustrates how to normalise the field before enrichment:
FROM office365-logins | EVAL ip_string = TO_STRING(`IP Address`) | ENRICH lupovis_ti_enrich_policy ON ip_string | WHERE ttps IS NOT NULLThis example follows the original guide's approach.
The exact conversion required depends on the mappings of the source and enrichment fields. For example, converting an ip-mapped field into a string may be inappropriate if the enrichment policy expects an IP value.
Validate the field types and adjust the query for your Elastic deployment.
Interpreting enriched results
When the query identifies matching intelligence, analysts can investigate the associated authentication events.
For example, a successful sign-in originating from an IP previously observed performing credential attacks may warrant additional investigation.
Analysts should consider:
Whether the authentication succeeded.
Whether MFA was completed.
Whether the device was recognised.
Whether the source IP is expected.
Whether the user performed unusual actions after authentication.
How recently the hostile activity was observed.
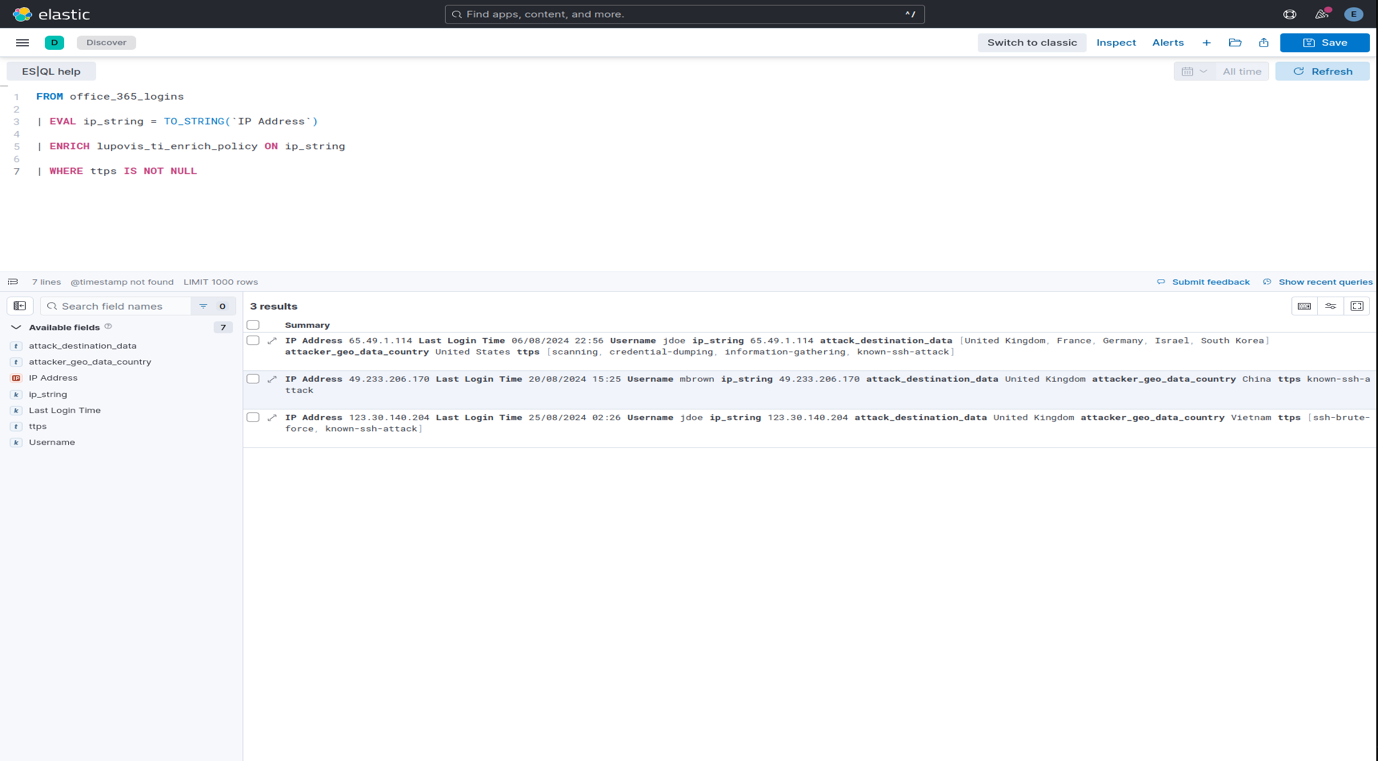
A threat intelligence match should be treated as investigative context rather than definitive evidence of account compromise.
6. Operational security use cases
Identity threat detection
Correlate authentication events with hostile IP intelligence to identify potentially suspicious login activity.
This can help analysts prioritise investigations involving password attacks, unusual authentication patterns and access attempts from previously observed hostile infrastructure.
Firewall and perimeter monitoring
Enrich firewall, VPN and network-flow events with intelligence about scanning, brute-force attempts and other observed attacker behaviour.
This provides additional context when assessing whether network events warrant further investigation.
Threat hunting
Use known indicators as starting points for investigations.
Analysts can identify related activity, examine affected assets and investigate historical events associated with suspicious infrastructure.
Detection engineering
Incorporate threat intelligence into detection rules alongside behavioural signals and environmental context.
Combining multiple signals can improve prioritisation compared with alerting solely on IP reputation or threat feed membership.
Reporting and visualisation
Use enriched telemetry to support dashboards showing:
Events associated with known hostile IP addresses.
Frequently observed attack techniques.
Trends in hostile activity.
Geographic context associated with observed infrastructure.
Investigation outcomes and response activity.
Geographic information should be interpreted carefully because infrastructure location does not necessarily indicate an attacker's physical location.
7. Troubleshooting
No threat intelligence records appear in Discover
Check the Elastic Agent's health, API authentication, integration configuration, polling interval and data-stream name.
Confirm that the correct data view and time range are selected.
Bulk API ingestion fails
Validate that the request body uses the correct NDJSON format.
Inspect the Bulk API response for individual document errors.
Check index mappings, authentication and index privileges.
Enrichment returns no matches
Confirm that the source IP values match and that both fields use compatible data types.
Verify that the enrichment policy has been executed.
Also confirm that the query references the correct index and policy.
Newly ingested indicators are missing
Re-execute the enrichment policy after updating the threat intelligence index.
Existing enrich lookup data does not automatically refresh when the underlying source index changes.
TTP or CVE fields are missing
Inspect the actual API response and Elasticsearch mappings.
Not every intelligence record necessarily contains every metadata field.
Too many alerts are generated
Avoid treating every threat intelligence match as an incident.
Combine matches with event severity, authentication outcomes, behavioural evidence and other contextual information.
8. Production deployment checklist
Before using Lupovis Threat Intelligence in production detection workflows, confirm the following:
The Lupovis API key is valid and stored securely.
The appropriate production feed is selected.
The API response format has been validated.
Elasticsearch mappings are configured correctly.
Threat intelligence documents are being ingested successfully.
The enrichment policy has been created and executed.
ES|QL correlation queries have been tested.
Known matching and non-matching IP addresses produce the expected results.
Feed updates and enrichment policy refreshes are scheduled.
Monitoring and retry handling are configured.
Data retention and credential rotation requirements are addressed.
9. Conclusion
Integrating Lupovis Threat Intelligence into Elastic enables organisations to add attacker context to their existing security telemetry.
Whether using Elastic Fleet or direct API ingestion, the intelligence can support detection, investigation and threat hunting by correlating internal events with previously observed hostile activity.
Through Elasticsearch enrichment policies and ES|QL, security teams can bring together threat indicators, attacker behaviour and operational telemetry in a single investigative workflow.
This helps analysts prioritise suspicious activity, reduce manual cross-referencing and make more informed security decisions.
For production use, validate the intelligence feed schema, ensure enrichment policies remain current and combine threat intelligence matches with additional security evidence.
Was this helpful?
Still need help? Share an idea